
How wrong was Jay Bhattacharya’s Great Barrington Declaration?
A new study gives us an idea. The answer is very.

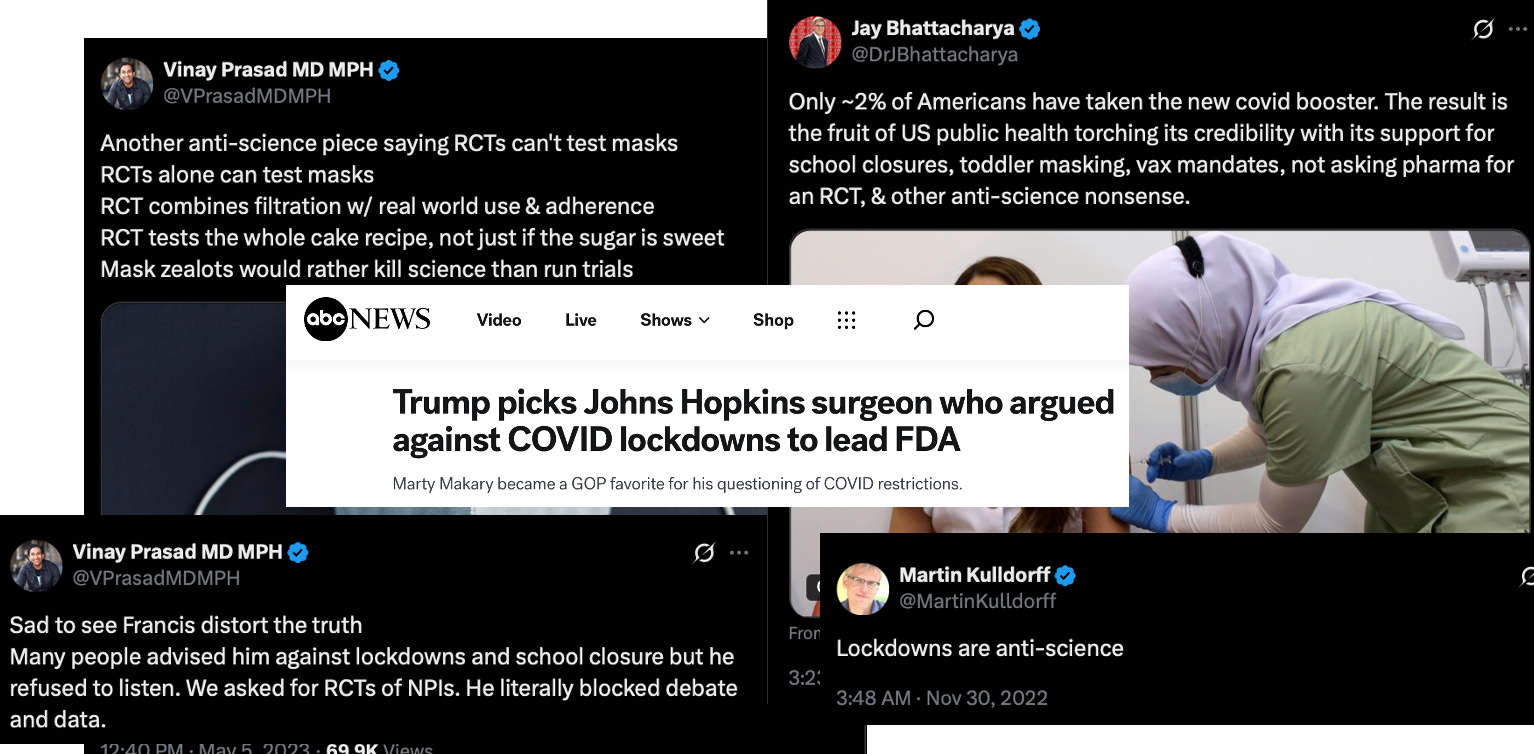
In April of 2020, Jay Bhattacharya orchestrated a now widely discredited and demonstrably incorrect study suggesting COVID was no worse than the flu. Five months later he joined with two co-authors with the support of the American Institute for Economic Research to release the Great Barrington Declaration, a document suggesting that, if we simply protect the elderly, everyone else can return to normal. Shelter in Place orders, travel bans, school and business closures, mask mandates, and social distancing were costly and controversial. Vaccines had yet to be released, so these non-pharmaceutical interventions (NPIs) were the only tools available to limit the spread of COVID. According to Bhattacharya and his colleagues, all of it was a waste of time and money for anyone under the age of 65. “Lockdowns are anti-science” complained Martin Kulldorff, a co-author of the GBD and key advisor to Kennedy’s autism study. Bhattacharya spent the pandemic railing against NPIs, complaining in 2023 that, by supporting school closures and masking of young children, US public health was “torching its credibility”. Others brought on by RFK Jr. to lead HHS such as Marty Makary and Vinay Prasad have vocally supported these positions.
Were they right? Would we have fared just as well without NPIs? This is a deceptively difficult question. It’s easy to count deaths but there will never be a database for tracking lives saved. We do have studies that show the effectiveness of vaccines and can estimate their impact but NPIs are a complex mix of interventions and, as discussed below, they are far more difficult to assess. In my new study just released in the Journal of Public Health Policy,1 I introduce a new method for assessing the combined effectiveness of NPIs that suggests an answer to this question. They were wrong. Very wrong.
My paper describes a remarkably simple model that estimates state COVID mortality rates in the US with extraordinary accuracy. That model, in turn, suggests that eliminating NPIs as suggested by the GBD would have caused an additional 850,000 COVID related deaths. Developing this estimate required a novel approach to estimating the effectiveness of NPIs. To understand this innovation, let’s take a closer look at NPIs.
Measuring Swiss Cheese

NPIs involve multiple interventions to control disease transmission. Some protect the individual. Some protect the community. As portrayed in this diagram created early in the pandemic by Australian virologist, Ian Mackay, none of these interventions is perfect and their effectiveness is modified by the presence of other interventions as well the prevailing severity of the epidemic. To make matters worse, some NPIs are often implemented in response to high disease rates creating a positive correlation that has nothing to do with their effectiveness. This makes isolating the effect of individual interventions extremely difficult. In the heat of an epidemic, conducting, the best tool for isolating individual effects, a placebo-controlled trials, becomes not only impractical but also, if there is any existing evidence that a particular intervention does work, unethical. Even if we did have the results of randomized trials for individual interventions, they are always implemented as a group. Because NPIs act synergistically, those findings could not be easily aggregated to estimate their combined effects.
So how can we study the aggregated effect of NPIs on COVID? The answer, it turns out, is by not looking at COVID. The best way to understand the effect of NPI’s on COVID is to look at their effect on other respiratory diseases.
What Happened to Other Respiratory Viruses During the Pandemic?
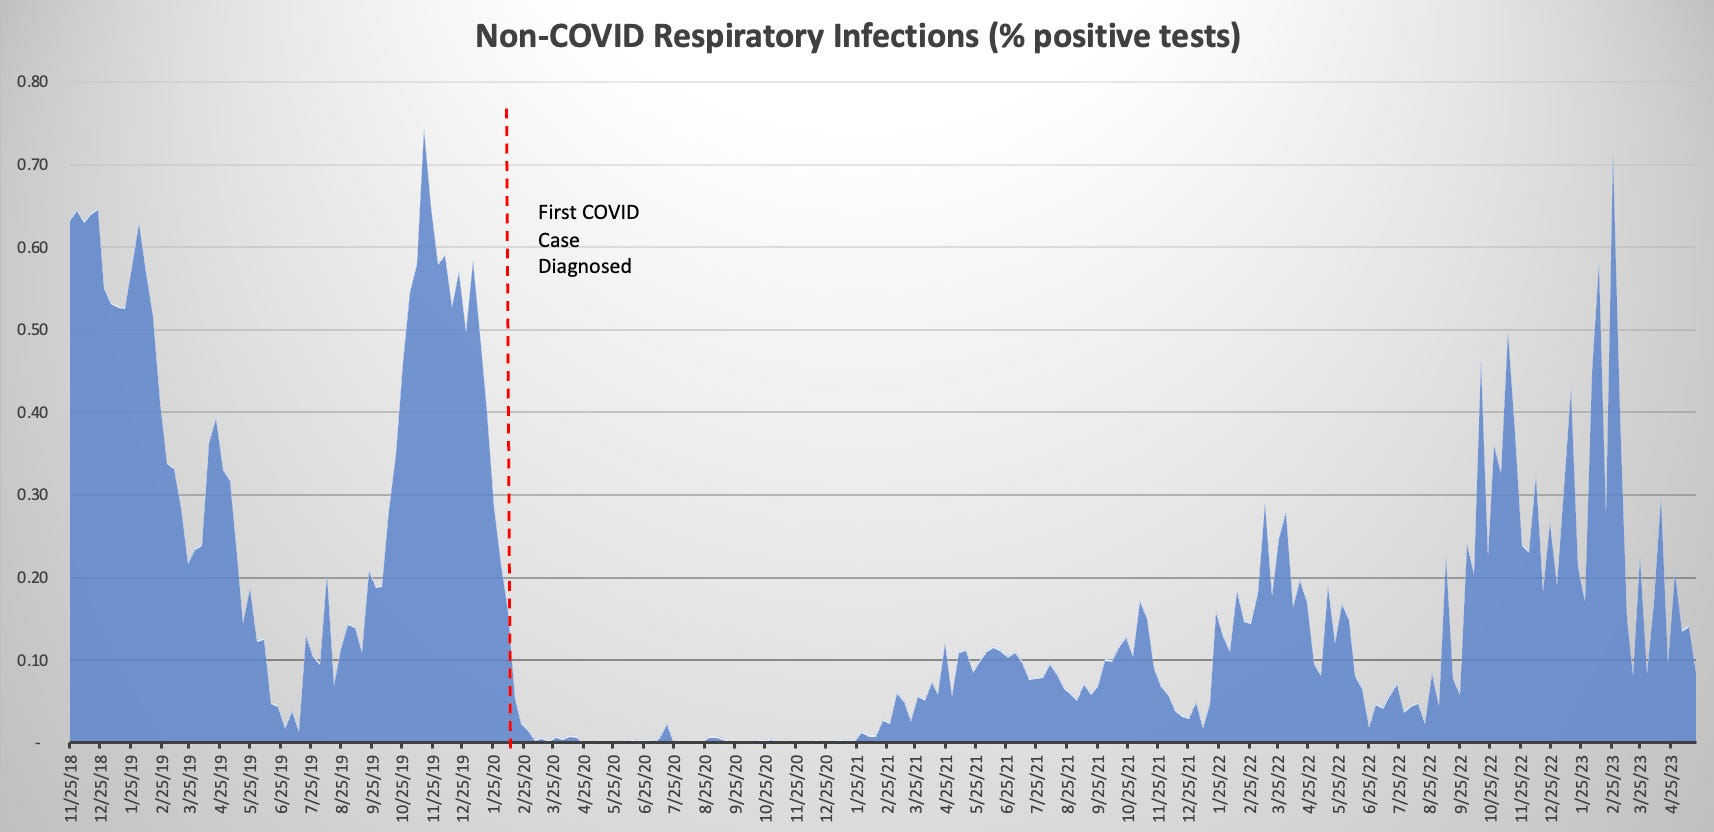
In November of 2018, Helen Chu, an infectious disease physician and researcher at the University of Washington, launched The Seattle Flu Study with a plan to test for a broad range of respiratory viruses in anyone presenting at any of 16 hospitals and clinics with symptoms consistent with a respiratory infection. This gave Chu and her team a remarkable window into the COVID pandemic including providing a library of samples that were used to track the origins of disease in Seattle prior to the first reported case. One of the most striking findings was what happened to non-COVID respiratory infections during the pandemic. The data show that, for almost a year, non-COVID respiratory infections largely disappeared and did not return to pre-pandemic levels for almost three years. Of all the conceivable explanations, by far the most likely is that COVID NPIs were reducing the spread of all respiratory infections.
In some ways, we know all of this to be true intuitively. I, for one, spent two years without any respiratory infections for the first time in my life. Most of my friends had similar experiences. But let’s not resort to anecdote. Consider the most contagious airborne infection, measles, which is 5-10 times more contagiousthan COVID. 2019 was the worst year for measles in 25 years with 1,314 cases. In 2020, there were 13, the lowest rate of measles ever recorded in the United States. Only one thing could have caused that 99% decline, the aggregated effect of COVID NPIs.
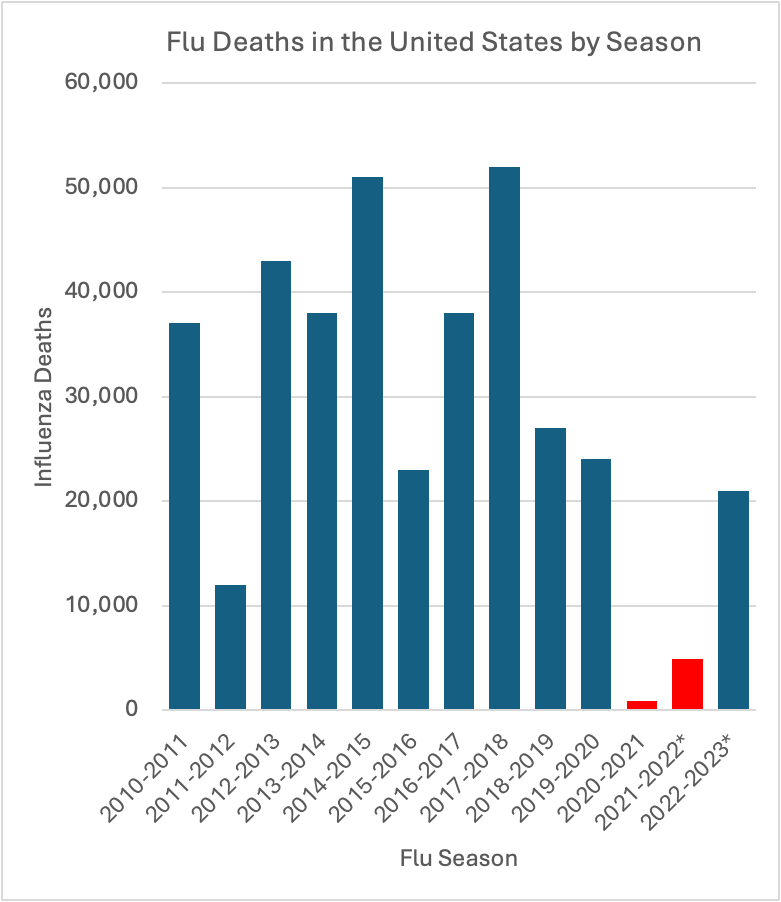
If the reduction in the rate of other respiratory diseases reflects the effectiveness of COVID NPIs, then a national data set for disease with historical data and state level detail provides a surrogate for the effect of NPIs on COVID. The CDC’s influenza surveillance data give us exactly that. In the nine flu seasons prior to COVID, there were an average of 36,000 flu deaths every year. During the 2020-2021 season, flu mortality dropped by 97% from pre-pandemic levels nationwide. The extent of that Influenza Mortality Reduction (IMR) varied from state-to-state. That variability allows us to use it as an indicator of the effectiveness of NPIs in each state.
Predicting COVID mortality rates
In addition to NPIs, the incidence of COVID (or any new infection) in a state is determined by three things.
1. Introduction of new cases: People entering the state with COVID
During the first few months of 2020, travelers with COVID were entering the US without restrictions. With that in mind, COVID mortality rates through March of 2020 provide a surrogate for the baseline rate of introduction of new cases.
2. Baseline Transmission: Spread of COVID under normal conditions (no interventions) in the state.
Given COVID’s demonstrated ability to spread in crowds, the extent of crowding in a state should correlate with the ability of new cases to spread. Population density provides a simple, readily available measure of the underlying potential for disease transmission in each state.
3. Population Immunity: Primarily the rate of vaccination in the population with infection derived immunity playing an increasing role as the pandemic progresses.
Vaccination is the only one of these factors for which there are accurate, easily obtainable data.
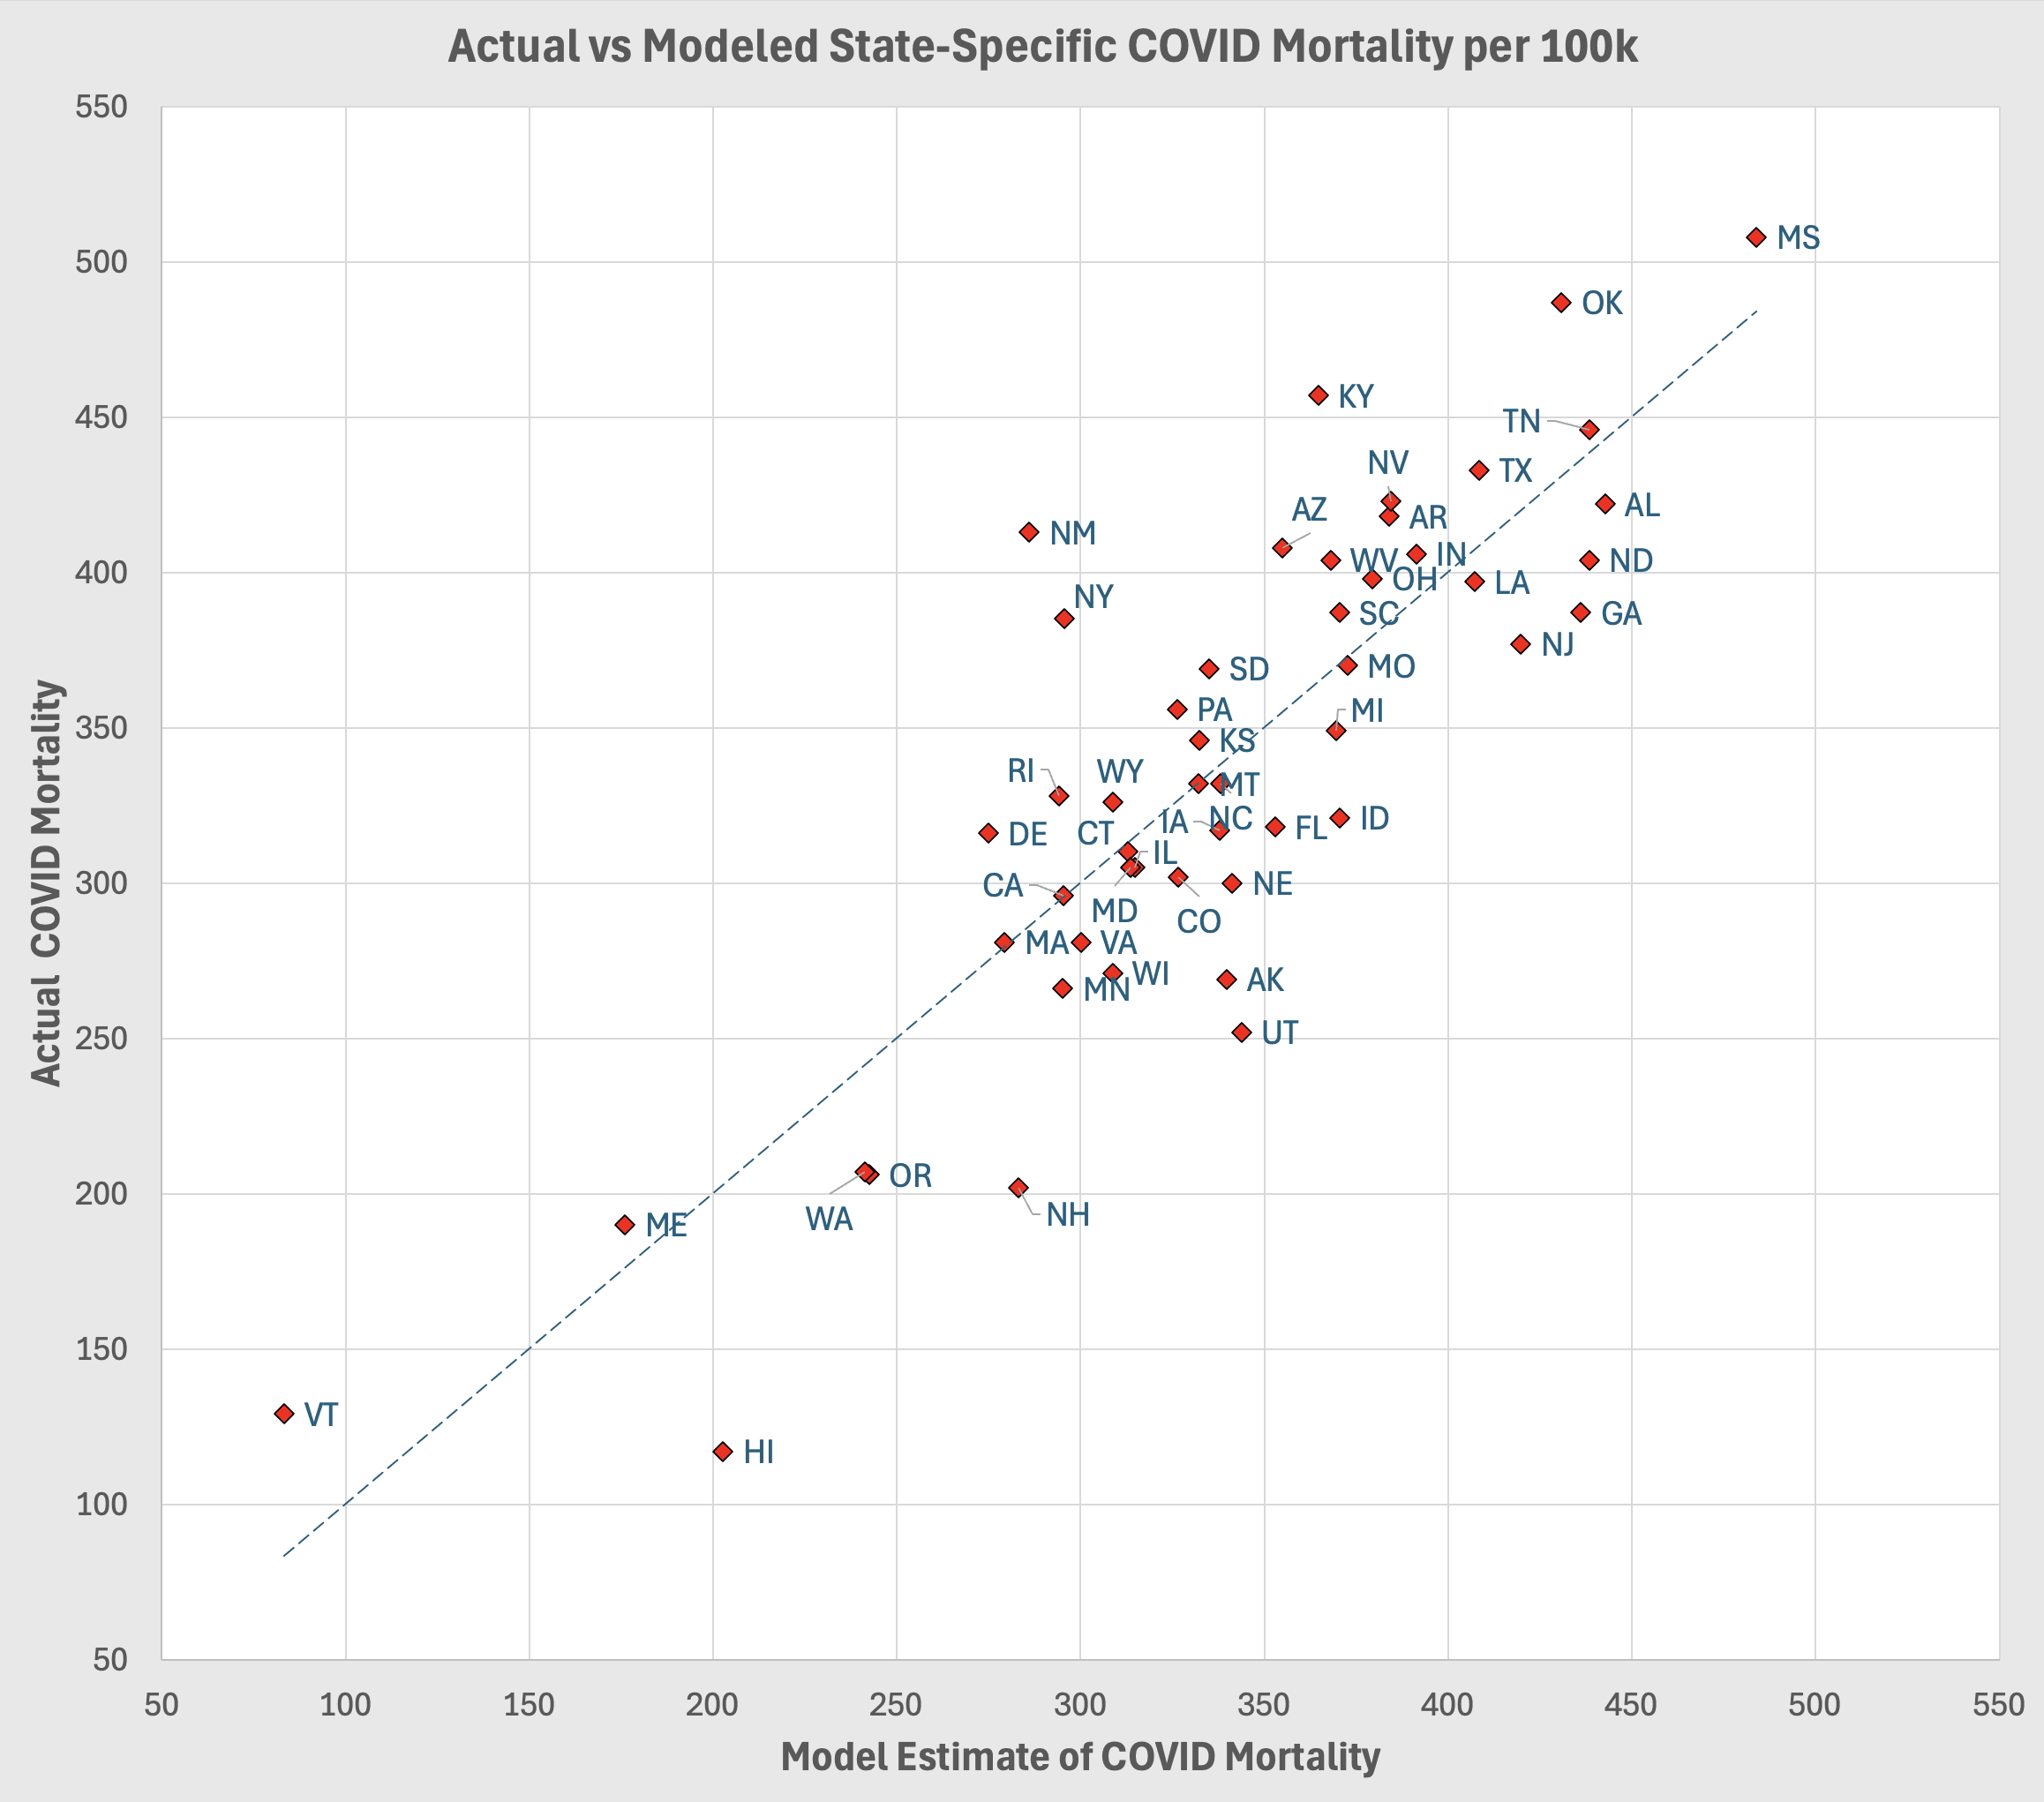
Using these three variables plus the Influenza Mortality Reduction (IMR) for each state to estimate COVID mortality through September of 2023 explained 70% of the variability in state COVID mortality rates. I cannot overstate how astonishing it is that a model using state level data and four relatively crude surrogates for the key factors contributing to disease mortality has this level of explanatory power. In 35 years as an epidemiologist, I have never seen anything like it. The close fit of the model to the data justifies taking it a step further by using to estimate COVID mortality under different, hypothetical conditions.
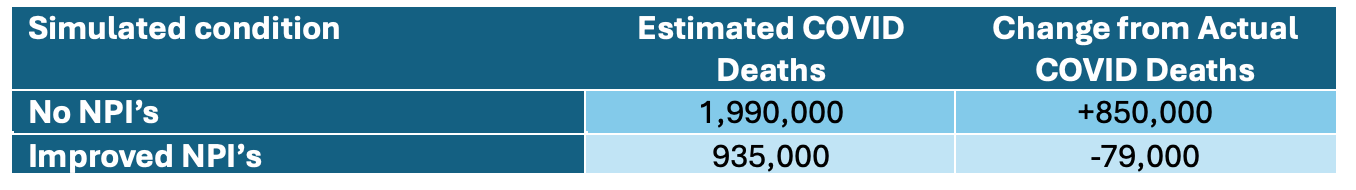
The accuracy of this model allows us to use it to consider the impact of a public health strategy based on the Great Barrington Declaration. Assume that we had followed the advice suggested by Bhattacharya and his colleagues and allowed life as normal throughout the pandemic. Since IMR is our surrogate measure for NPIs, we can estimate the impact of no NPIs by setting that variable to zero for all states and running the model. The resulting model predicts that implementing this laissez faire approach in the United States would have resulted in almost 2 million COVID deaths, an increase of 850,000 from what we observed. If, on the other hand, we had employed more stringent NPIs to match the state with the greatest IMR, which was Washington (94%), we could have saved an additional 79,000 lives.
Bottom Line
The study suggests that following the advice of Bhattacharya and his colleagues in the Great Barrington Declaration would have been a disaster, almost doubling the number of COVID deaths in the US. Much more work is required to know how much each intervention contributed, but, assuming infectious disease research is not killed by the misguided leadership of Trump and RFK Jr., I am optimistic that we can tease out these insights from the trove of available data.
Bhattacharya is primarily a health economist and the GBD does raise an important economic question. Specifically, how do we balance the economic costs of NPIs against the lives they save. Unfortunately, many of the so-called COVID contrarians sought to do cost/benefit analyses by using sloppy or disingenuous epidemiology to suggest that NPIs don’t work or vaccines are dangerous. There should no longer be a question. NPIs prevented hundreds of thousands of COVID related deaths. Yes, interventions had costs. Yes, we should do the cost-benefit analysis and seek out the most cost-effective options. We can and should do better, but failing to acknowledge the benefits of NPIs and implement them in the future will kill with certainty.
The Japanese have masked to what most considered extreme for years before Covid. I wonder who could extend the IRM with that data?
Thanks! It's been disappointing to see how many people address this question without treating it in a straightforward counterfactual way. It's great to see that fixed.